We spend a lot of time talking about democracy but very little time actually defining it. Democracy comes from the Greek words ‘demos’ (people) and ‘kratos’ (power.) For many centuries after the collapse of the Athenian democracy and the Greek and Roman Republics, democracy (people power) was synonymous with mob rule, chaos and insecurity. Many assumed that a majority rule democracy would oppress minorities. This fear was one of the elements that encouraged America’s founding fathers to institute the electoral college and create the Senate.
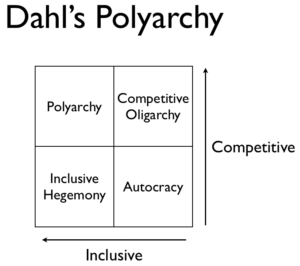
Due to widespread overuse and misinterpretation, many political scientists prefer the term polyarchy, which means ‘many rule’ over the term democracy. ‘Polyarchy’ is the title of a seminal political science book by Robert Dahl. In this book, Dahl proposes that all governments have two variables – competitiveness and inclusiveness – and can be placed on a graph with those two axis.
Competitiveness asks who can compete for political office.  America’s competitiveness is much lower than Israel’s because America’s two mainstream political parties effectively prevent people with diverse perspectives from running for office while Israel’s multi-party coalition system enables almost anyone to run.
Inclusiveness asks who can vote. America does much better than Israel here because all American citizens can vote while only Israeli citizens can vote – excluding the non-citizen Palestinians who live on Israeli occupied lands.
Dahl’s definition of polyarchy is good, but not complete. His graph doesn’t account for the most powerful force in politics: information distribution. Those who control access to information have tremendous political power. They can amplify certain elements within society and silence others. They can create the illusion of competitiveness and inclusiveness, amplify certain social elements while silencing others, and create false narratives. Information is power and it must be included in Dahl’s analysis, but how?
Three important questions arise when thinking about information: who can create it, how is it distributed and how can it be applied. The first question is technical: does the population have access to information creation tools? The second is technical/cultural: who has the technology to distribute it and the cultural capital needed to get people to pay attention? The third is entirely cultural: what can individuals, communities and organizations do with the information they process?
Transparency is the key component that addresses all of these questions as one. Transparency requires everyone have the ability to create, distribute and use information. There is no barrier between a totally transparent government and the society it serves. In that instance, government and society become one. Institutions are a third element in the transparency matrix. Their existence ensures that a totally transparent government will never exist. However, by intelligently using network technologies, we can get close.
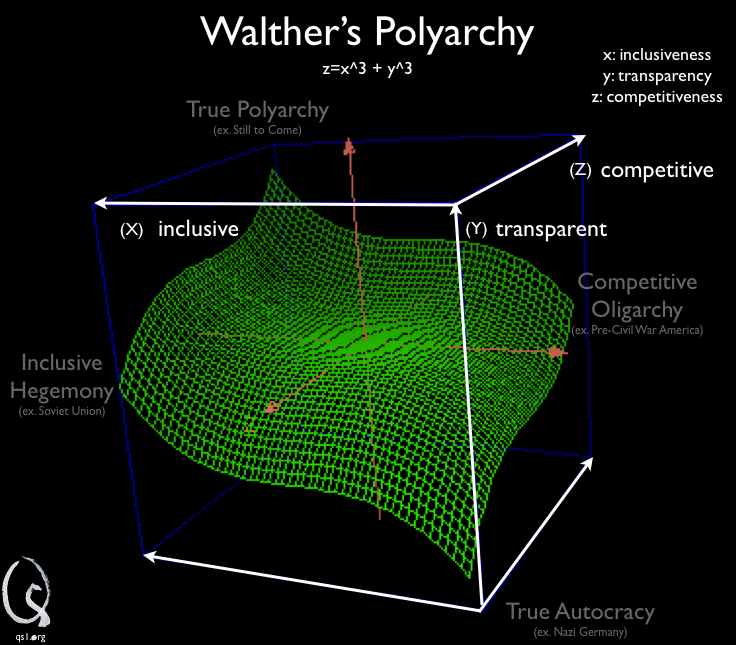
When transparency is added as the third dimension to Dalh’s polyarchy graph, the possibility a relationship between competitiveness and inclusiveness arises within a 3 dimensional space. This possibility becomes reality in the graph z=x^3 + y^3.

In this graph, a positively transparent society is placed into the top left area of polyarchy while a negatively transparent society (one in which information is used to create false realities) brings you towards the bottom right area of authoritarianism. A society that is inclusive but not competitive has a negative transparency because a lot of people are supporting a poor selection of leaders so false realities is constructed to help people view this situation as acceptable. A society that is competitive but not inclusive is highly transparent because each included individual receives an unusually high return on their vote. In the real world, a highly inclusive but minimally competitive government like the Soviet Union had a vast propaganda machine while the highly competitive but relatively non-inclusive post-revolution America had a thriving, decentralized information distribution businesses.
The next step is clear: we need to solve for transparency. Given two variables we could, theoretically, plot societies on the x^3+Y^3 plane and even watch as they move across it over time. The implications for this would be tremendous. Imagine if America adopted a foreign policy of transparency whose only mission was to facilitate the creation of transparent national governments. I think this is precisely the type of metric we need to create a global coalition of friendly, democratic and free nations.